- Based on Census data, voter turnout increased in 2022 by 1.6 points among citizens with disabilities relative to the 2018 midterm elections, while it decreased among citizens without disabilities by 1.6 points.
- This increase helped close but did not eliminate the turnout gap between citizens with and without disabilities, which went from -4.8 points in 2018 to -1.5 points in 2022.
- The increased turnout among people with disabilities occurred across all disability types and demographic categories—gender, race/ethnicity, age group, and region—but was especially pronounced among young voters with disabilities.
Success of Mailed-out Ballot Access Policies Nationwide
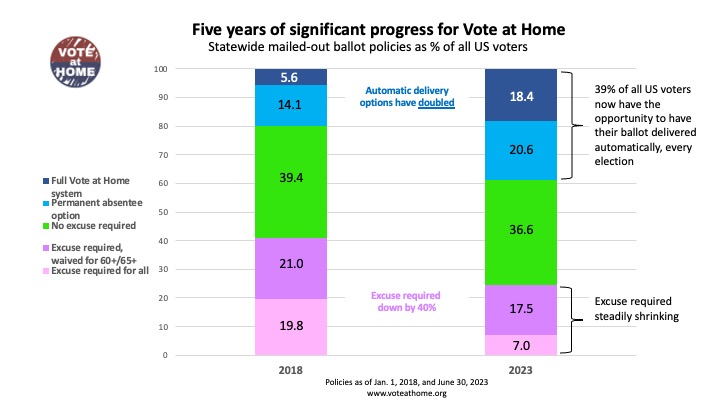
Much was written about the success of temporary policies states put in place for mailed-out ballot access during the 2020 election due to the pandemic. The resulting use of those ballots and the percentage of the popular vote they represented (about 47%) was indeed stunning. But a largely untold story is how rapidly voters across the country have had their access to mailed-out ballots improved on a permanent policy basis. The result was in the 2022 midterms about 32% of all ballots cast came from those voters received in the mail, up from about 21% in 2018.
State-by-State Youth Voter Turnout Data and the Impact of Election Laws in 2022
(CIRCLE) — New estimates of youth voter turnout in the 2022 midterm elections highlight major variations and inequities in young people’s electoral participation across the country. Youth turnout ranged from as high as 37% in some states to as low as 13% in others.
These new estimates are out today from the Center for Information & Research on Civic Learning and Engagement (CIRCLE) at Tufts University’s Tisch College of Civic Life, the preeminent national research center on youth voting. They are based on voter file data from 39 states for which age-specific voter file data has been aggregated by Catalist. We define turnout as the percentage of all voting-eligible youth (as opposed to just registered youth), ages 18-29, who cast a ballot in 2022.
According to this new data, Michigan (37%), Maine, Minnesota, Oregon (all 36%), Colorado (33%), and Pennsylvania (32%) had the highest youth turnout rates in the country. Louisiana (16%), Oklahoma, Indiana, Alabama (all 15%), West Virginia (14%), and Tennessee (13%) had the lowest youth turnout rates. CIRCLE’s analyses suggest that, along with issues and electoral competitiveness, election laws may be playing a central role in shaping whether youth cast a ballot in national elections.
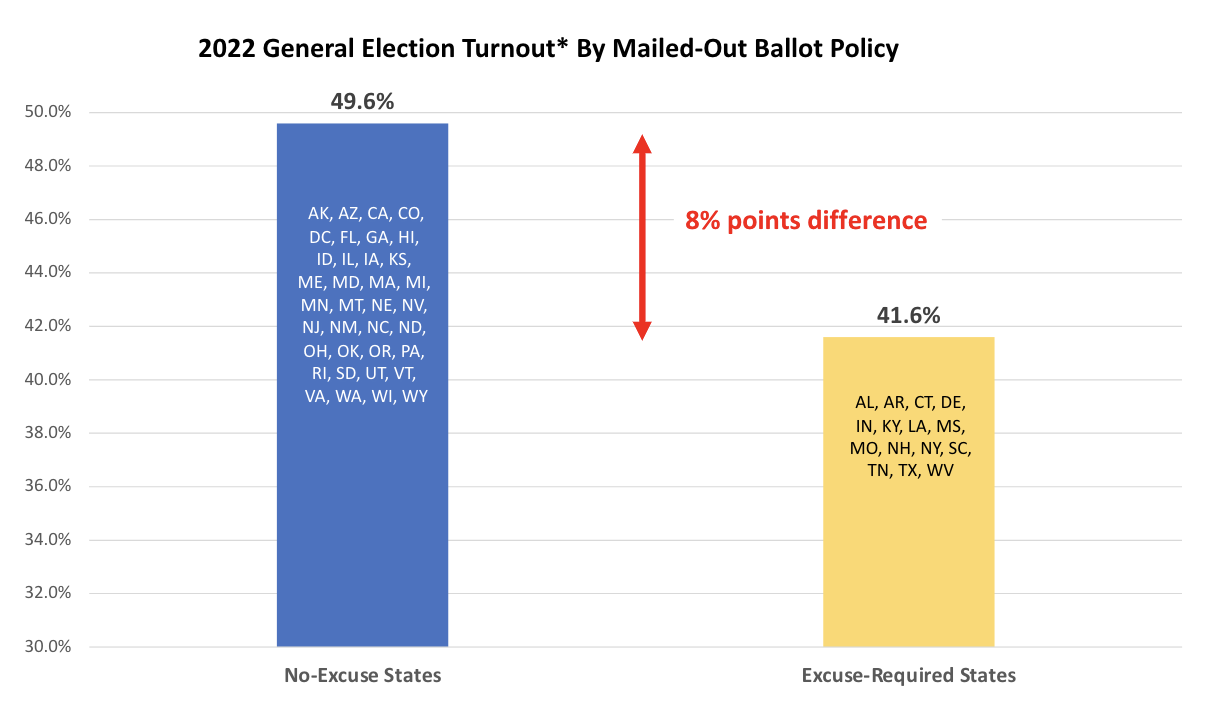
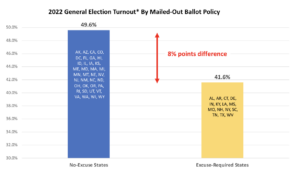
2022 General Election Turnout by Mailed-out Ballot Policy
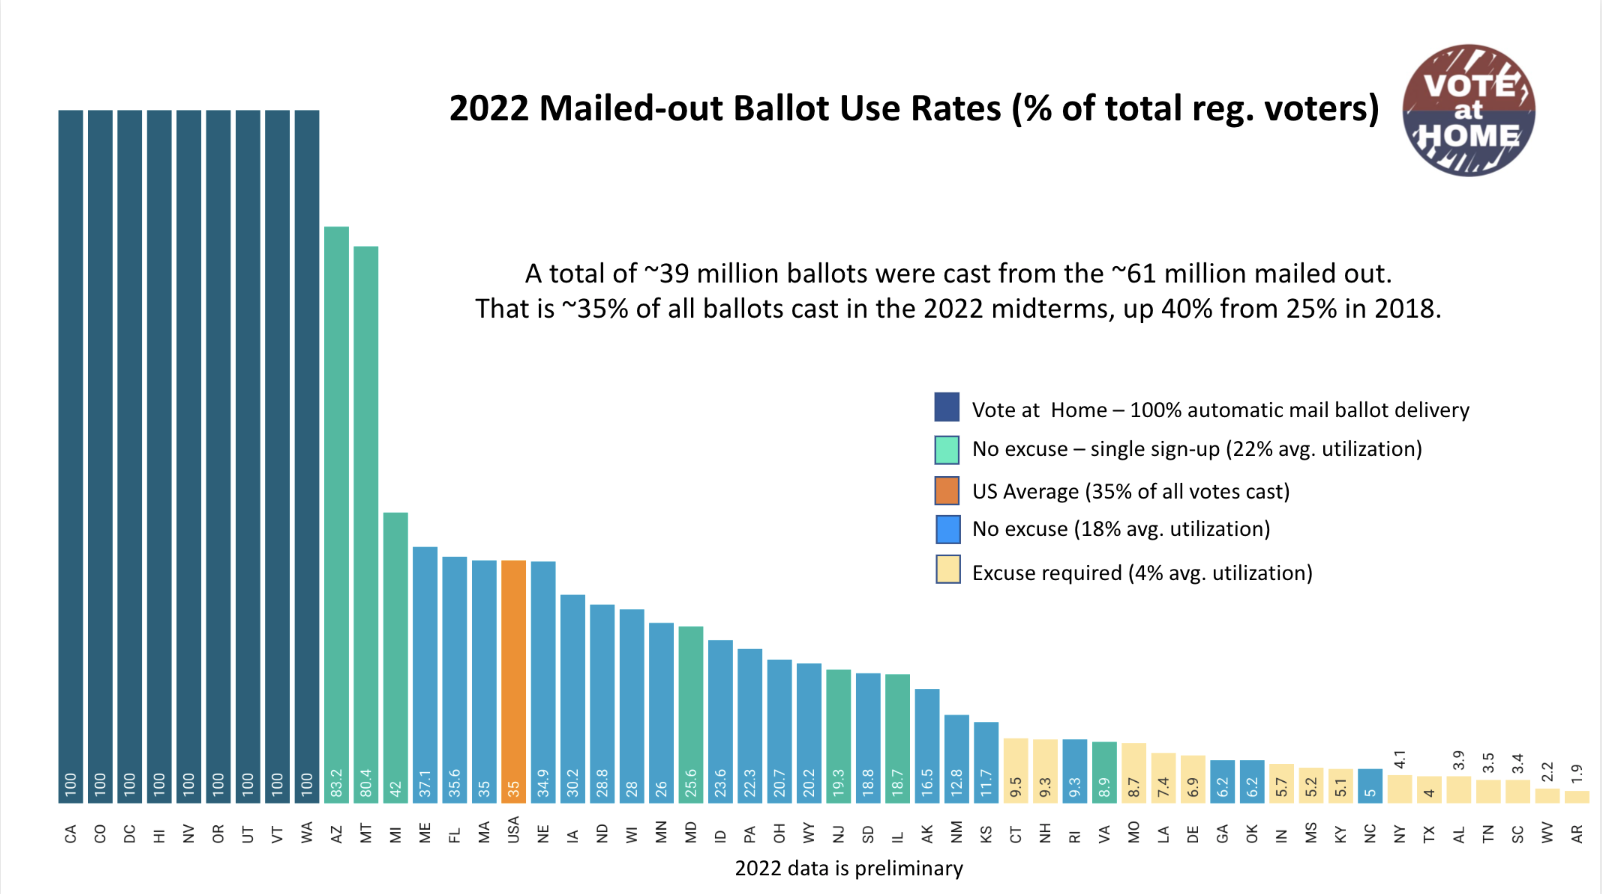
2022 Mailed-out Ballot Use Rates (% of total reg. voters)
A total of ~39 million ballots were cast from the ~61 million mailed out.That is ~35% of all ballots cast in the 2022 midterms, up 40% from 25% in 2018.
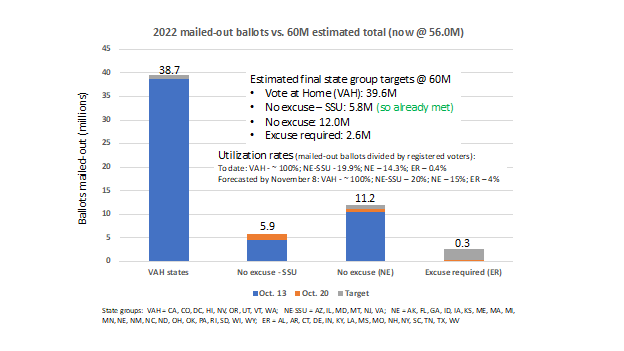
NVAHI Mailed-out Ballot Tracking and Forecasting Tool
October 14, 2022: Today the National Vote at Home Institute (NVAHI) launched a new tool to help journalists, legislators, elections officials and the public forecast the likely level and impact of mailed-out ballots for the 2022 general election.
Modeling Voter Participation in 2018 Midterm Election
In this research, we examine the difference between five vote-by-mail policies in place in the 2018 midterm elections. We use statistical modeling to understand the effects of different vote-by-mail policies nationwide and estimate what might have changed in 2018 based on different voting systems. In general, we find that turnout increases as states move along the vote-by-mail policy continuum, removing administrative obstacles for voters in the process. Additionally, turnout gains are largest when counties progress several steps from more restrictive policies to less restrictive policies, and the Vote at Home policy has the most potential to impact young voters.
Cost of Voting in the American States: 2022
(Election Law Journal) — A recent nonpartisan academic study that ranked all 50 states based on the amount of time, energy, and resources people must make to vote was released this week. To no surprise, of the top 10 states for ease of voting, eight are the nation’s only states conducting full vote-at-home elections in 2022, during which all voters will automatically be mailed ballots for the upcoming midterms. As for the bottom 10 states, seven require their voters to attest to a valid excuse in order to obtain a mailed-out ballot.
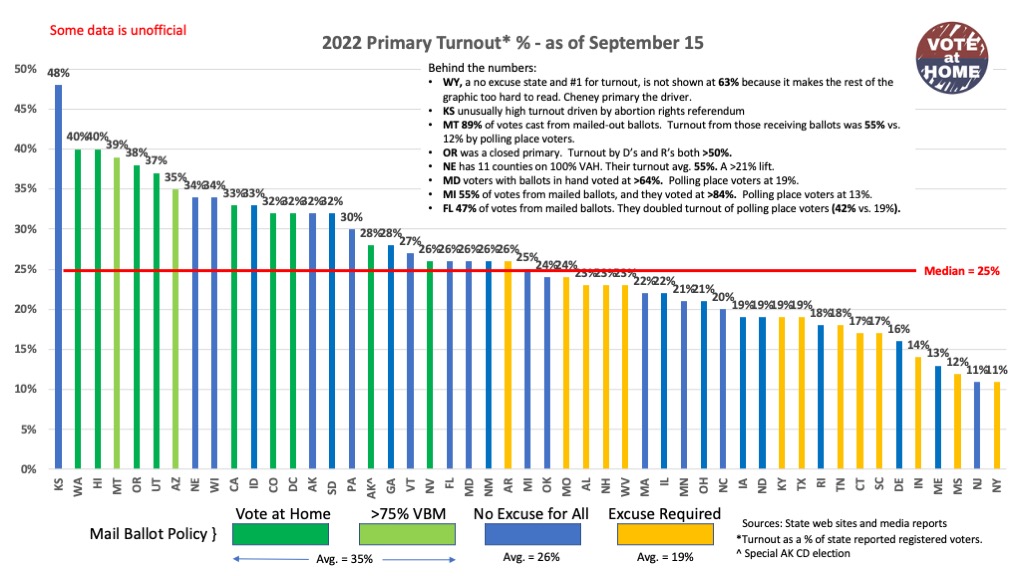
Mail Ballot Voters Turnout at Higher Rates than Polling Place Voters
Since 2020, mail-ballot use has been on the rise across the U.S., resulting in more voters having access to the ballot box. The 2022 primary elections were no exception.
Examination to Tabulation: Ballot Pre-processing Policies Explained
In this explainer, Bipartisan Policy Center and National Vote at Home Institute focus on the states that allow election workers to run ballots through scanners before Election Day. This policy provides the most preparation for tabulation, which occurs after polls close on Election Day and before the release of unofficial results. By understanding the benefits of this policy along with other ballot pre-election processes (ranging from verifying signatures to curing ballots), policymakers can expedite the release of unofficial election night returns, mitigating the harmful impacts of election mis- and disinformation.

