Prior to the COVID-19 pandemic, some American states had transitioned to universal voting-by-mail, where all registered voters receive a mail ballot. But due to the pandemic, universal voting-by-mail was suddenly used in a larger number of states in2020. Here we study a unique situation in which registered voters in some legislative districts in Los Angeles County were subjected to universal voting-by-mail in theMarch 2020 primary. Using difference-in-differences and geographic boundary-based designs on individual-level records, we take advantage of this within-jurisdiction situation to estimate the causal effects of universal voting-by-mail on voter turnout and on who votes. Our results indicate that voter turnout increased by 3 to 4 percentage points for voters who do not automatically receive a mail ballot, and the increase is generally larger for registered partisan voters than those without a party affiliation.
Who’s Voting for America’s Mayors? Hardly Anyone
September 2024
Every two years, leading politicians, journalists, interest groups, and citizens turn their collective attention to the upcoming presidential or midterm elections. Presidents, U.S. Senators and Representatives, and most statewide and state legislative officials are chosen in these contests.
In the most recent (2020) presidential general election, we know that about 2 in 3 eligible voters cast ballots. In recent midterm (2022) contests, it’s closer to 1 in 2. And in party primaries, where the eventual winners in the vast majority of partisan races are actually decided, the typical participation rate is about 1 in 4 voters. But not all elections are held in these even numbered years.
In fact, Americans select the vast majority of their elected officials in odd-numbered years, determining the electoral fate in most states of hundreds of thousands of local office-holders: mayors, city and county commissioners, school board and other special district board members, and more. The typical extremely low levels of voter turnout in these contests seldom receives mention, even in local news stories. Rarer still is any meaningful discussion of potential steps to address this problem, which some entrenched incumbents and their supporters don’t see as a real “problem.” However, we respectfully disagree.
The first goal of this white paper is to examine this important topic by focusing on voter turnout for one specific type of local office, city mayors, in a range of U.S. states that held such elections in 2023. For this analysis, we first identified 9 states from across the U.S. where mayoral elections are held in odd-numbered years, and in which voters were typically expected to go to an assigned polling place to cast their ballots.
We then focused on the ten largest cities (by population) in these states. In all 9 of these states, we found at least two of these larger cities had contested mayoral races in 2023. Among these nine states (Illinois, Maine, Maryland, Massachusetts, Michigan, Minnesota, New Mexico, Pennsylvania, and Vermont), a total of 36 contested mayoral elections occurred in 2023 among their 10 most populous cities.
For comparison purposes, we also looked at three other states (Colorado, Montana, and Washington) where 2023 mayoral races were conducted quite differently, using a Vote at Home election system. All active registered voters were automatically mailed their ballots several weeks before the elections, and voters could then mark and return them by mail, or by taking them to a secure drop box or other official site. Among these three states’ most populous cities, 11 contested mayoral contests were conducted in this manner. (While Colorado and Washington hold all their elections this way, Montana state law gives local governments the ability to hold such elections, which all three of these Montana cities did.) The second group of states was chosen to shed light on what we believe is one of the most powerful but too little known or discussed ways to significantly boost voter turnout in these and other kinds of off-cycle elections.
A better-known proposal to address this low turnout problem is to move these odd-year local contests to coincide with even-year presidential and midterm elections. Several large U.S. cities (e.g, Baltimore and Los Angeles) have already adopted this idea. While this approach will almost certainly boost turnout, it inherently carries a major risk. By moving to even-year elections, mayoral and other local candidates and their races will become largely overshadowed, if not submerged entirely, by the far more visible and attention-grabbing “top of the ticket” contests for President, U.S. Congress, Governor, and other offices.
As our analysis reveals, a “Vote at Home” election model avoids this inherent conflict, allowing local races to still take center stage, while boosting turnout in significant ways.
The Impact of Universal Vote by Mail and Permanent Absentee Voting on Turnout in 2020 and 2022
This memo presents evidence on the efficacy of universal vote by mail (UVBM) and permanent absentee voting (PAV). With UVBM, all registered voters are sent a ballot in the mail without needing to proactively request one. With PAV (also known as “single signup”), voters sign up once to receive ballots in the mail for all subsequent elections.
Like other state voting laws (ID, early voting, etc.), UVBM and PAV may have a significant impact on whether people actually turnout to vote. Both methods significantly reduce the obstacles in the way of voting by bringing the polling place to the voter rather than making the voter go to the polling place. VoteAmerica has conducted a number of analyses aimed at assessing this impact and find that both methods substantially boost voter turnout.
Vote at Home Policy and Research Guide
Many states are undertaking pro-democracy reforms to improve voter access and engagement, including Same Day / Election Day (SDR / EDR) registration, online registration, automatic voter registration (AVR), and early in-person voting (EIPV). Many of these efforts have focused on engaging the electorate at the point of registration, but less so on removing barriers that prevent already-registered voters from exercising their right to actually cast their ballots. Vote at Home (VAH) focuses on removing those barriers, although full VAH states also incorporate best practices that improve voter registration and the ongoing maintenance of voter registration files.
18-34 Year Old 2020 Turnout Overall and by Key Race and Ethnicities
An analysis of voting file data provides powerful, new evidence of significantly higher turnout in the 2020 presidential election among 18–34-year-olds, including voters of color, in Vote at Home jurisdictions in which all active registered voters automatically received paper ballots via the U.S. mail before the election. Young voters by key race and ethnicities had significantly higher turnout rates — calculated by the Citizen Voting Age Population and Active Registered Voter denominators — in Vote at Home states in contrast to 2020 battleground states or 2020 non-VAH states with Same Day/Election Day Registration or Automatic Voter Registration.
Disability and Voter Turnout in the 2022 Elections
- Based on Census data, voter turnout increased in 2022 by 1.6 points among citizens with disabilities relative to the 2018 midterm elections, while it decreased among citizens without disabilities by 1.6 points.
- This increase helped close but did not eliminate the turnout gap between citizens with and without disabilities, which went from -4.8 points in 2018 to -1.5 points in 2022.
- The increased turnout among people with disabilities occurred across all disability types and demographic categories—gender, race/ethnicity, age group, and region—but was especially pronounced among young voters with disabilities.
Value of Ballots in Hand
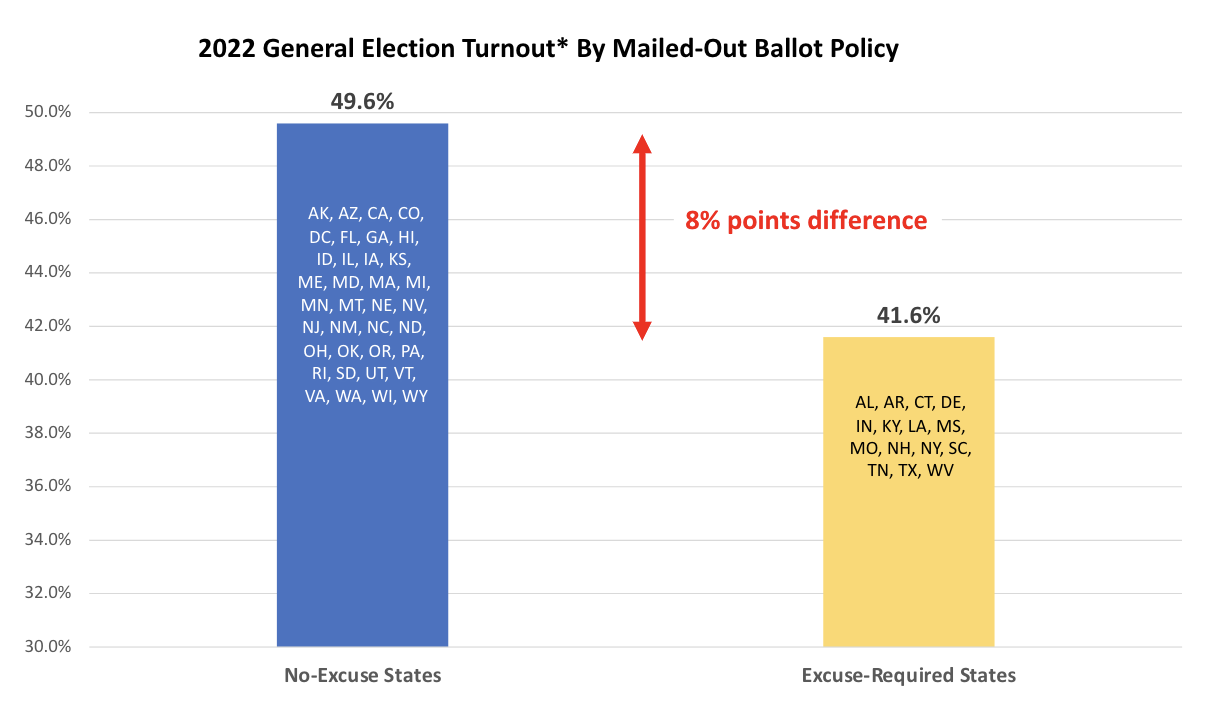
As campaigns nationwide, from local to presidential, consider whether it’s worth getting mailed-out ballots into the hands of voters, the National Vote at Home Institute(NVAHI) has an answer: YES. Voting at home via mailed-out ballots significantly increases voter turnout.
This white paper provides the what, the why, the where, and the who: the increased level of turnout that voting at home provides, comprehensive details on which states and voters are the best targets for outreach efforts, and the potential increase in turnout that mailed-out ballots deliver.
Success of Mailed-out Ballot Access Policies Nationwide
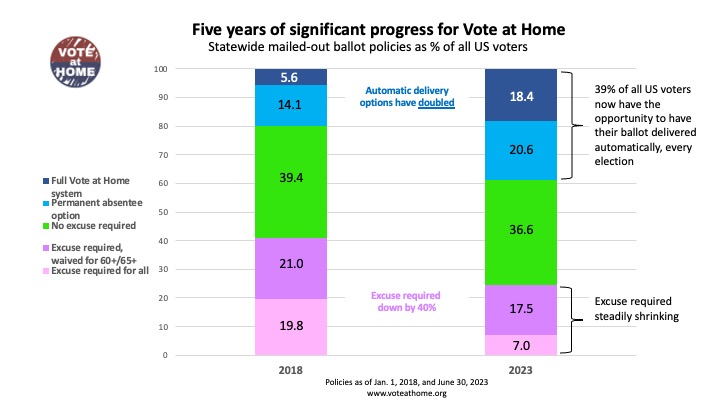
Much was written about the success of temporary policies states put in place for mailed-out ballot access during the 2020 election due to the pandemic. The resulting use of those ballots and the percentage of the popular vote they represented (about 47%) was indeed stunning. But a largely untold story is how rapidly voters across the country have had their access to mailed-out ballots improved on a permanent policy basis. The result was in the 2022 midterms about 32% of all ballots cast came from those voters received in the mail, up from about 21% in 2018.
State-by-State Youth Voter Turnout Data and the Impact of Election Laws in 2022
(CIRCLE) — New estimates of youth voter turnout in the 2022 midterm elections highlight major variations and inequities in young people’s electoral participation across the country. Youth turnout ranged from as high as 37% in some states to as low as 13% in others.
These new estimates are out today from the Center for Information & Research on Civic Learning and Engagement (CIRCLE) at Tufts University’s Tisch College of Civic Life, the preeminent national research center on youth voting. They are based on voter file data from 39 states for which age-specific voter file data has been aggregated by Catalist. We define turnout as the percentage of all voting-eligible youth (as opposed to just registered youth), ages 18-29, who cast a ballot in 2022.
According to this new data, Michigan (37%), Maine, Minnesota, Oregon (all 36%), Colorado (33%), and Pennsylvania (32%) had the highest youth turnout rates in the country. Louisiana (16%), Oklahoma, Indiana, Alabama (all 15%), West Virginia (14%), and Tennessee (13%) had the lowest youth turnout rates. CIRCLE’s analyses suggest that, along with issues and electoral competitiveness, election laws may be playing a central role in shaping whether youth cast a ballot in national elections.

