
Some obvious (and not-so-obvious) wins for mailed-out ballot voting.
As the numbers continue to come in from the midterms, we can already see some obvious wins for mailed-out ballot voting. With over 60 million mailed-out ballots, returns of those still tracking towards 42 million or better, and about 120 million total votes cast nationally, the MOBET estimate of 35% of all votes cast appears very much in reach. But there were state-level issues that also show the power and shift to mailed-out ballots.
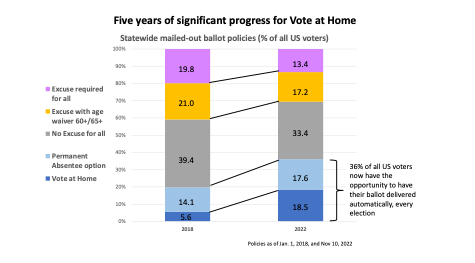
In Michigan, Proposition 2 passed easily adding MI to the six previous states with a “single sign-up (SSU)” or permanent absentee option for its voters. Prop 2 also added other NVAHI best practices including ample secure drop boxes, ballot tracking, and prepaid return postage. Not only did that move MI well up National Vote at Home’s state scorecard, but it also means that now over 36% of US registered voters live in a state that either automatically mails ballots to all active registered voters for every election (aka Vote at Home) or allows voters to opt into that system for themselves. That’s up from under 20% just five years ago.
Nebraska continued to build on NVAHI’s groundbreaking research on their “county-option” model. For the midterms, the state averaged 52.8% turnout. But the eleven counties that have opted to go to 100% mailed-out ballots averaged 68.3% – a full 15%+ points higher.
Based on their move to no-excuse mailed-out ballot voting, Massachusetts had over 1.2 million mailed-out ballots in 2022, up over 10x from just 105,000 in 2018. It appears when the counting is done, about 80% of those will have been cast. In contrast, polling place voters turnout out is coming in at just over a 40% rate.
Wisconsin’s use of mailed-out ballots is up almost 5x from 2018 (168,000 to over 800,000).
Connecticut passed its Question 1 which approved early voting. While not a direct connection to mailed-out ballots, it shows voters there are ready to demand better access to their ballots, and so bodes well for the next step, the passage of HJR 58 (no excuse absentee) in their 2023 legislative session for its required second time, and then to a popular vote in 2024.
Speaking of the term “absentee,” did you notice on election night, every time the networks returned to Georgia’s nailbiter, they referred to the number of “mail” ballots left to count – not “absentee” ballots? Slowly, the language in the country is coming around to recognize that mailed-out ballot voting is not akin to being “absent” from the polls. It’s just another, more convenient way to participate in our democracy by making the “polls” come to you.
The MOBET tool presents mailed-out ballot totals – and eventual return rates – in four categories:
- 9 “Vote at Home” (VAH) jurisdictions, where every active registered voter receives a ballot in the mail automatically for every election
- 6 “No Excuse – Single Sign-Up” (NE/SSU) states, where any voter, through a single application, can sign up to automatically receive ballots for all future elections. Michigan now joins this group, bringing the total to seven going forward.
- 21 “No Excuse” (NE) states, where all voters are eligible to receive a ballot, but must request them for each specific election or every year
- 15 “Excuse Required” (ER) states, where most voters are ineligible to apply for a mailed-out ballot, unless they meet a specific legally acceptable excuse
*VAH = CA, CO, DC, HI, NV, OR, UT, VT, WA
*No Ex-SSU = AZ, IL, MD, MT, NJ, VA
*No Ex = AK, FL, GA, ID, IA, KS, ME, MA, MI, MN, NE, NM, NC, ND, OH, OK, PA, RI, SD, WI, WY
*Ex Req.= AL, AR, CT, DE, IN, KY, LA, MS, MO, NH, NY, SC, TN, TX, WV
Based on the numbers we now can see, in 2022 we now expect:
- Excuse required states to see 4% utilization, at best (mailed-out ballots divided by registered voters)
- No excuse states to see more than 4x that rate at about 17% utilization
- No excuse states that include SSU to see more than 5x the excuse required rate, at about 21% utilization
Vote at Home’s MOBET information tool relies on official data originating from state and local election officials, some of it compiled by trusted sources including the U.S. Elections Project and Catalist. See the original press announcement here: https://voteathome.org/national-vote-at-home-institute-launches-new-mailed-out-ballot-tracking-forecasting-tool/