- Based on Census data, voter turnout increased in 2022 by 1.6 points among citizens with disabilities relative to the 2018 midterm elections, while it decreased among citizens without disabilities by 1.6 points.
- This increase helped close but did not eliminate the turnout gap between citizens with and without disabilities, which went from -4.8 points in 2018 to -1.5 points in 2022.
- The increased turnout among people with disabilities occurred across all disability types and demographic categories—gender, race/ethnicity, age group, and region—but was especially pronounced among young voters with disabilities.
Success of Mailed-out Ballot Access Policies Nationwide
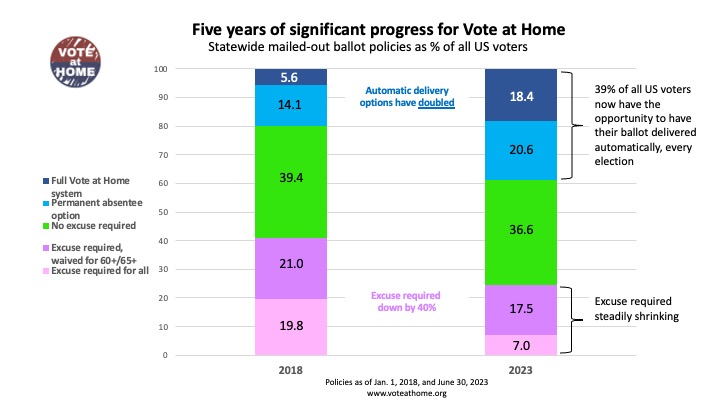
Much was written about the success of temporary policies states put in place for mailed-out ballot access during the 2020 election due to the pandemic. The resulting use of those ballots and the percentage of the popular vote they represented (about 47%) was indeed stunning. But a largely untold story is how rapidly voters across the country have had their access to mailed-out ballots improved on a permanent policy basis. The result was in the 2022 midterms about 32% of all ballots cast came from those voters received in the mail, up from about 21% in 2018.
Modeling Voter Participation in 2018 Midterm Election
In this research, we examine the difference between five vote-by-mail policies in place in the 2018 midterm elections. We use statistical modeling to understand the effects of different vote-by-mail policies nationwide and estimate what might have changed in 2018 based on different voting systems. In general, we find that turnout increases as states move along the vote-by-mail policy continuum, removing administrative obstacles for voters in the process. Additionally, turnout gains are largest when counties progress several steps from more restrictive policies to less restrictive policies, and the Vote at Home policy has the most potential to impact young voters.
Ensuring All Votes Count: Reducing Rejected Ballots
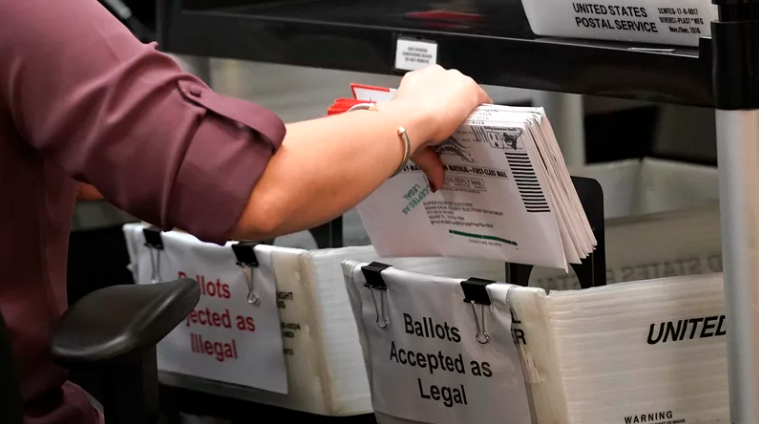
“This brief studies trends in mail ballot rejection rates in 2020 compared to previous years and how different factors, including sets of policies and policy changes, the political environment, and voter outreach, may have contributed to these changes in an extraordinary election year. Our main findings include:
- Mail ballot rejection rates decreased in most states in 2020 compared to 2018, and a number of states saw a consistent drop from 2016 to 2018 to 2020.
- Certain states that adapted their voting laws to make mail voting more accessible in 2020, particularly in the South, saw especially pronounced changes in rejection rates.
- In North Carolina, rejection rates vary from county to county. Previous studies of other states’ rejection rates found similar trends.
- States that implemented mail ballot policies, including ballot curing, increased ease of access when returning mail ballots at boards of elections, early voting sites, drop boxes, and ballot tracking, saw lower rejection rates than those that didn’t, though we caution against assuming a causal relationship.
- Previous academic and advocacy research suggests that voters of color, young voters, and first-time voters are disproportionately more likely to have their mail ballots rejected.”
Catalist Report 2018 Absentee by State by Age
Catalist and NVAHI have discussed the 2018 absentee and early vote totals and the impact of age. Below, we present the absentee and early vote (AVEV) distribution within the AVEV states in 2018, by age. The AVEV vote does not necessarily represent the general election electorate in each state – states vary in their adoption, and the regulations governing who can legally vote early or absentee – but in many states the AVEV vote represents a significant portion of the total 2018 vote.
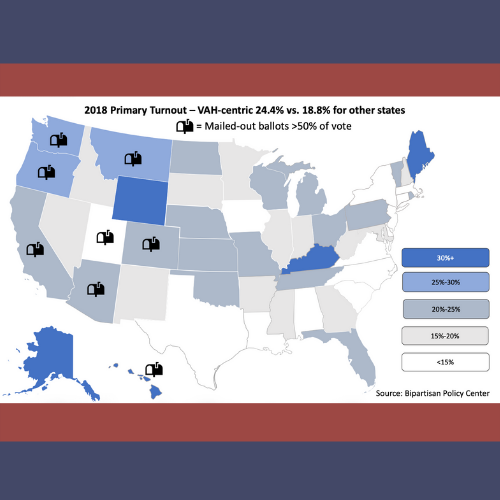
2018 Primary Election Turnout
This graph displays turnout by state in the 2018 primaries, in map form. Data from the Bipartisan Policy Center
Center for American Progress: Increasing Voter Participation in America
This report on methods to increase voter participation cites universal vote by mail, no-excuse mail voting, and vote centers as solutions.
How Electoral Institutions Affect Political Accountability
This research finds that expansion of vote at home systems increases turnout and reduces ballot roll-off.
Abstract: “A central question in the study of democratic governance concerns the conditions under which voters make informed choices at the ballot box. I exploit the staggered implementation of an electoral reform in a U.S. state to study the effects of electoral institutions on voter information and political accountability. I find that [vote at home] elections cause an increase in turnout in municipal elections and a decrease in ballot roll-off on statewide ballot measures in presidential election years in some counties, which is largely consistent with my argument that voters gather more information about politics when voting by mail. Further, there is strong evidence that vote-by-mail results in a decrease in taxing and spending in municipalities. The institution has less conclusive effects on municipal accountability audit outcomes. Using data from the Catalist voter file I show that these results cannot be explained by changes in the composition of the electorate caused by vote-by-mail.”
Mail Ballot Return Choices
This purpose of this report is to share research done by the National Vote at Home Institute (NVAHI) during the summer of 2018 into how true “Vote at Home” (VAH) jurisdictions operate when it comes to managing and driving voter behavior across the three major ballot return methodologies.

