Mail Ballot Security Features: A Primer

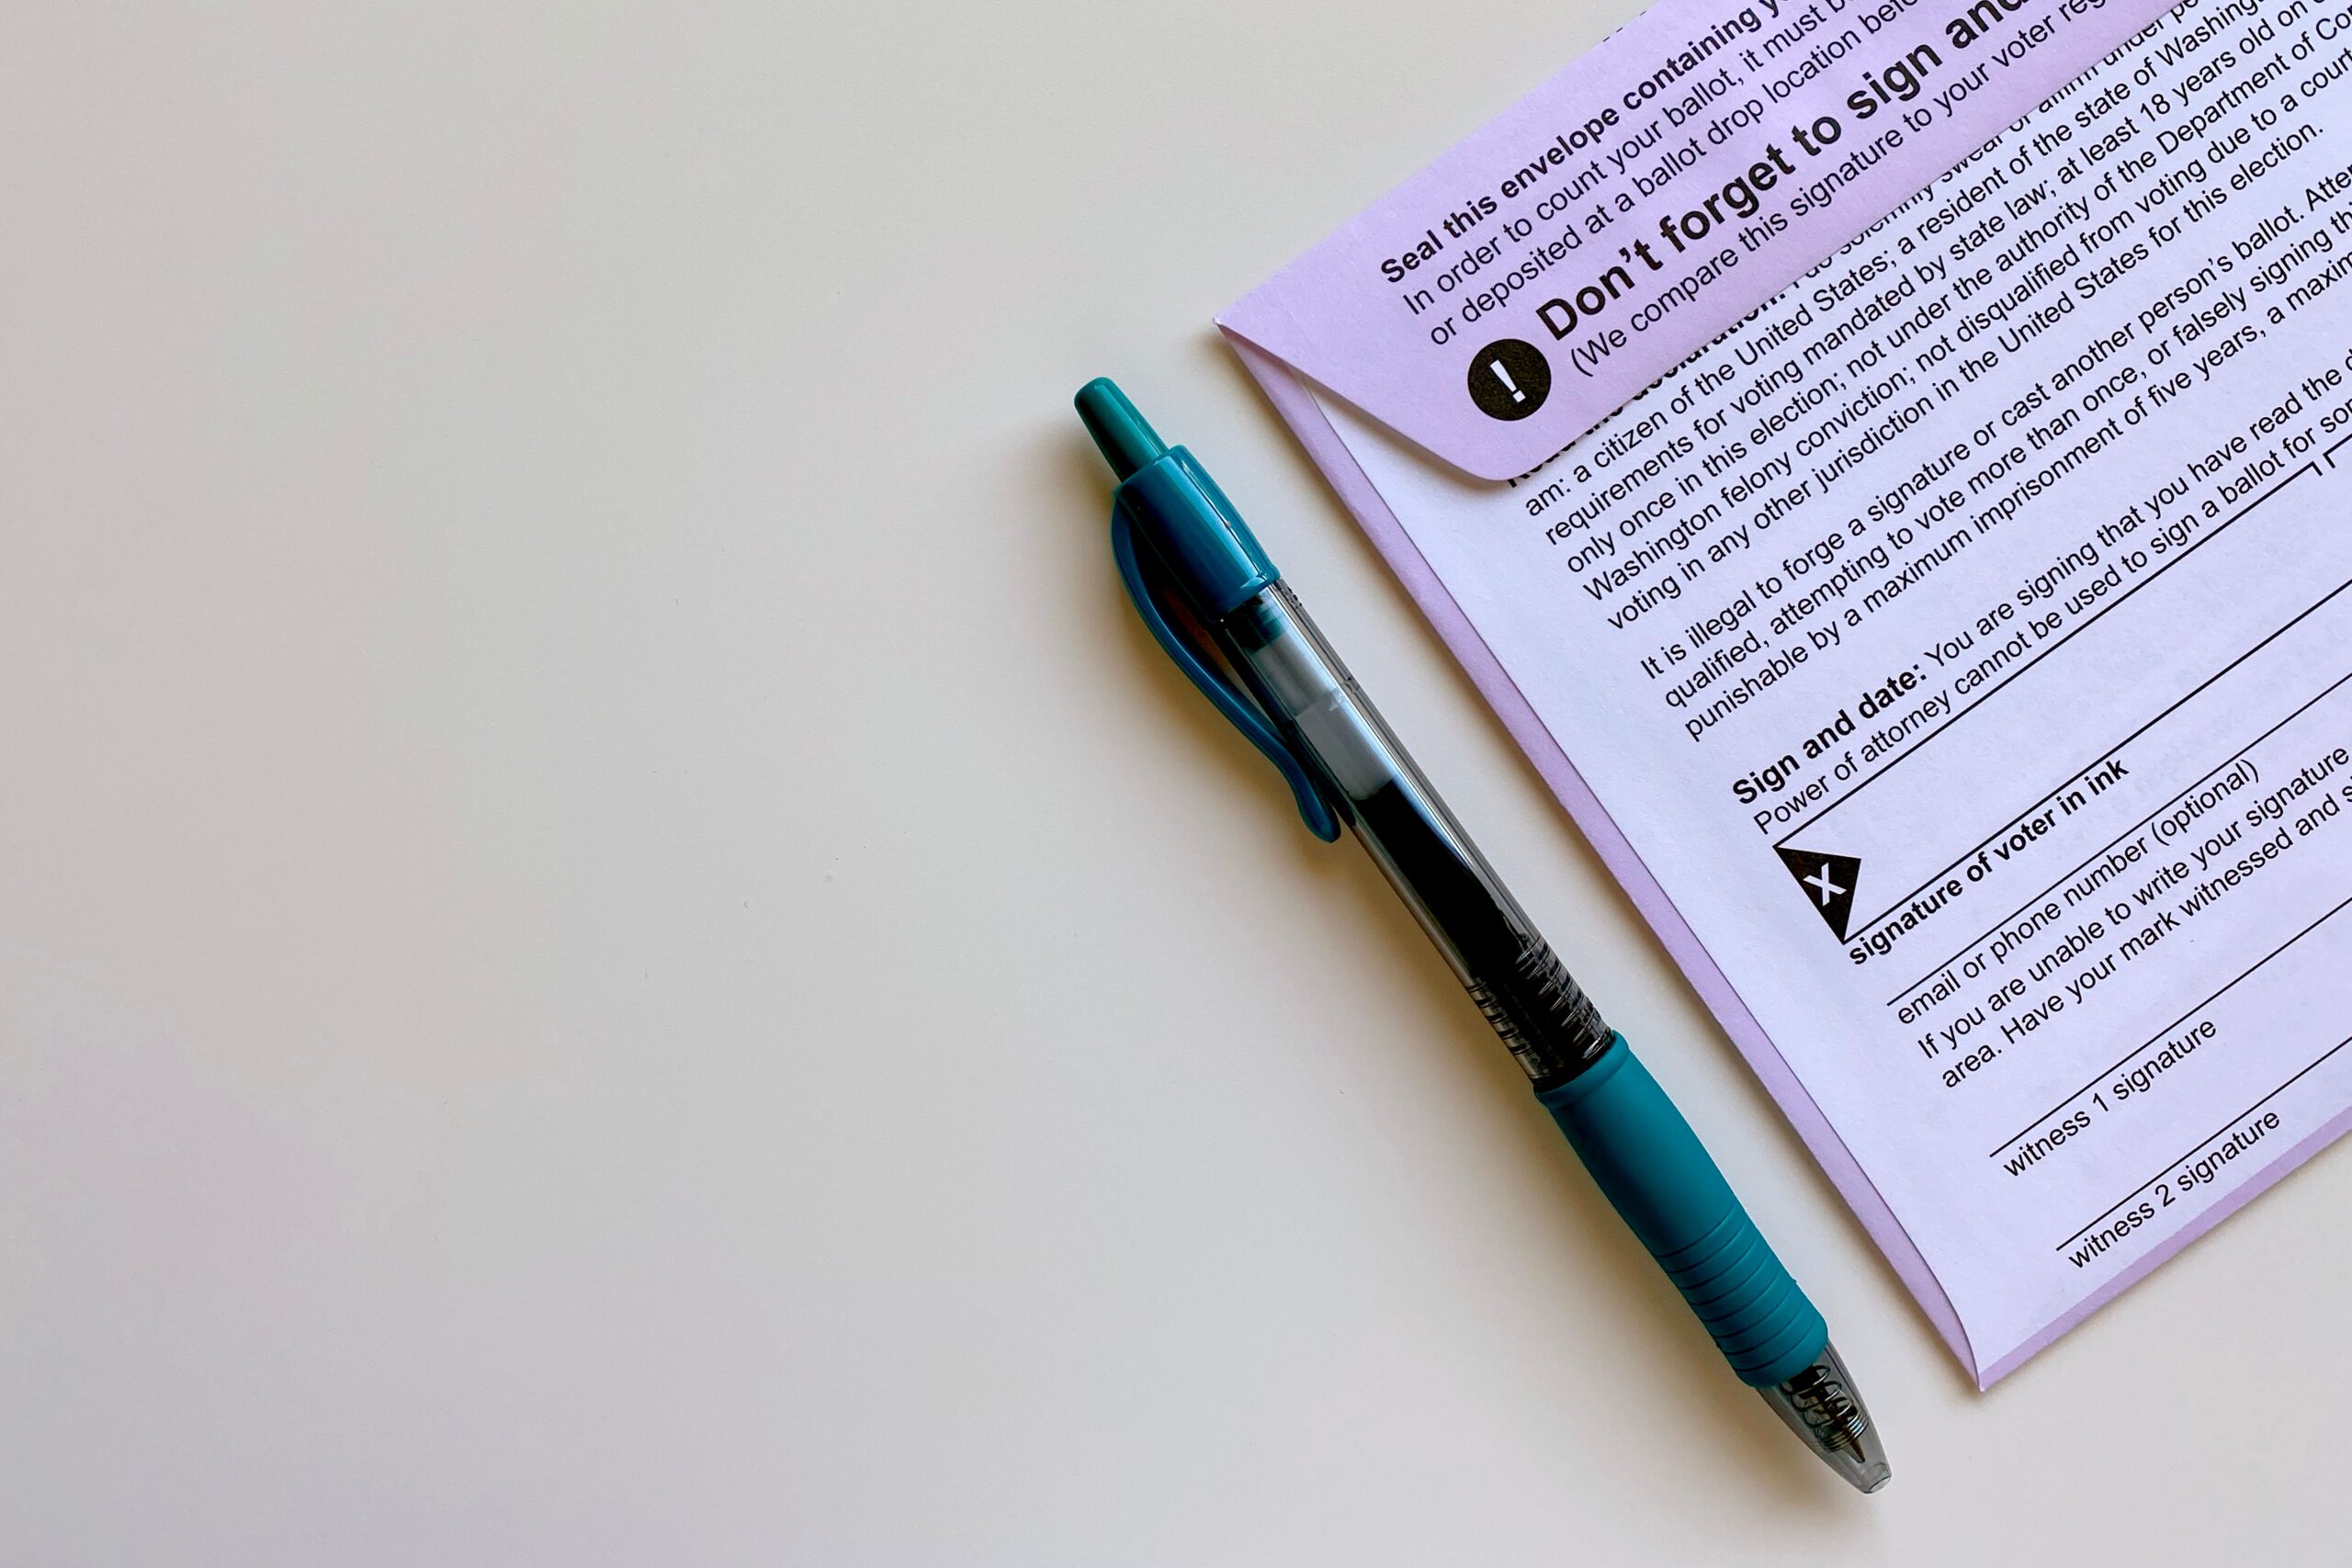
(Brennan Center) — Jurisdictions across the country have a range of security features to protect mail ballots from misconduct. Because of the Covid-19 pandemic, Americans are using mail ballots in record numbers this year. Fortunately, the use of mail ballots is not a newfangled idea; it was already deeply embedded in the American electoral system before the coronavirus hit.

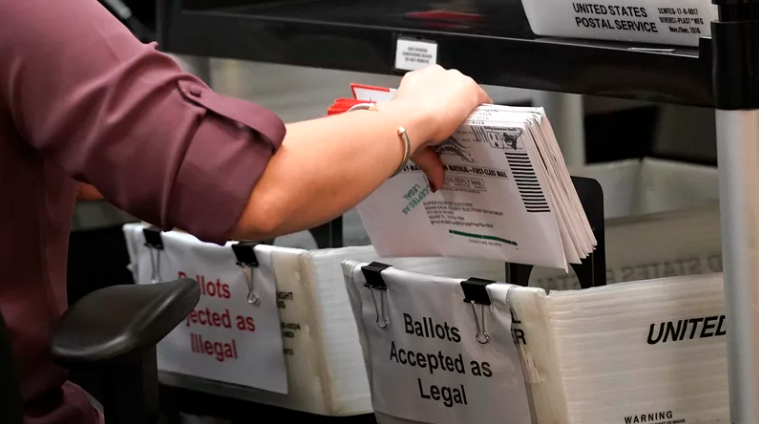
Ensuring All Votes Count: Reducing Rejected Ballots

“This brief studies trends in mail ballot rejection rates in 2020 compared to previous years and how different factors, including sets of policies and policy changes, the political environment, and voter outreach, may have contributed to these changes in an extraordinary election year. Our main findings include:

  • Mail ballot rejection rates decreased in most states in 2020 compared to 2018, and a number of states saw a consistent drop from 2016 to 2018 to 2020.
  • Certain states that adapted their voting laws to make mail voting more accessible in 2020, particularly in the South, saw especially pronounced changes in rejection rates.
  • In North Carolina, rejection rates vary from county to county. Previous studies of other states’ rejection rates found similar trends.
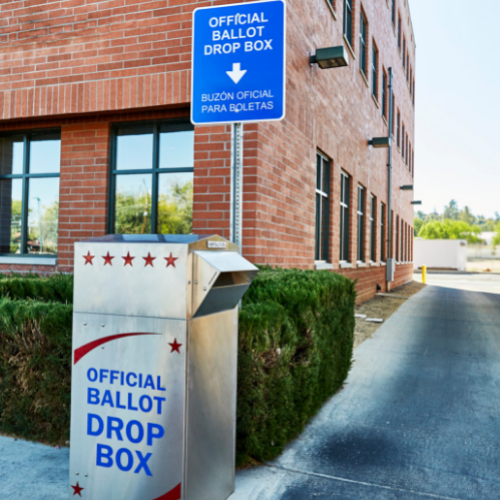
  • States that implemented mail ballot policies, including ballot curing, increased ease of access when returning mail ballots at boards of elections, early voting sites, drop boxes, and ballot tracking, saw lower rejection rates than those that didn’t, though we caution against assuming a causal relationship.
  • Previous academic and advocacy research suggests that voters of color, young voters, and first-time voters are disproportionately more likely to have their mail ballots rejected.”

State-by-State 2020 Youth Voter Turnout: The Northeast

From the Center for Information and Research On Civic Learning and Engagement: 

Our final analysis of statewide youth voter turnout by region examines the electoral participation in young people in nine Eastern and Northeastern states. Key takeaways from this group of states include:

  • New Jersey had the highest youth voter turnout in the nation: 67%. 
  • Despite being the only major swing state in the region, Pennsylvania had a similar youth voter turnout rate (54%) to other states in the East and Northeast. Perhaps relatedly, it’s the only state in the region (for which we have turnout data) without either pre-registration or automatic voter registration.
  • Vermont and New Jersey which implemented full vote by mail programs in which they automatically sent ballots to every voter, saw the biggest increases in youth voter turnout compared to 2016: rising by 12 and 22 percentage points, respectively.

America Goes to the Polls 2020

In an historic year for voter turnout, 2020 also underscored the power and importance of mailed-out ballots. In the top 10 states for highest turnout among eligible voters, half are full vote-at-home states. The remaining five states implemented same-day registration and put temporary policies in place making it easier to access a mail ballot. Conversely, the bottom 10 states cut off voter registration four weeks before Election Day and enforced excuse requirements for mail ballots. 

Participatory and Partisan Impacts of Mandatory Vote at Home

This research explores the effect of vote-by-mail on electoral outcomes by  using historical nationwide county-level data between 1992-2018 as well as 40 million individual-level voter records from Washington and Utah – both full vote-at-home states. The research finds a positive effect on turnout, with no discernable partisan advantage.

Safeguards for Equity in the Vote at Home Model

The following report outlines the most current research on the inclusion of these populations in existing VAH systems, as well as the elements in those systems that must be maintained in any new implementation models in order to increase that inclusion. As more states adopt these measures, we will continue to evaluate their impact on voters to close access gaps as much as possible.