A Deep Dive into Absentee Ballot Rejection in the 2020 General Election

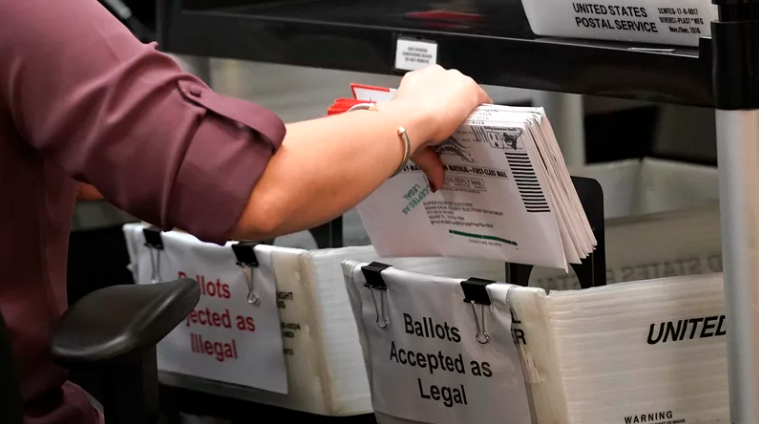
The November 2020 general election saw a surge of mail-in/absentee voting, mainly in response to safety concerns surrounding voting in-person during the COVID-19 pandemic. As a result, the overall total of mail ballots cast went from 28.8 million in 2016 to 66.4 million in 2020, a whopping 131 percent increase. With it likely that mail-in voting will continue to be prevalent, it is important to examine the nuances of the data more deeply, in order to improve the process for voters and election administrators alike. Today, we hone in on one particular facet of mail voting during the 2020 general election, absentee ballot rejection.


In this exploration, we see that absentee/mail-ballot rejection rates dropped significantly in 2020 compared to 2016, dropping the most in states that had previously erected high barriers to the use of mail ballots. Pre-processing laws and deadlines for the receipt of mail ballots didn’t seem to have much effect on rejection rates. Policy choices that did seem to matter were requiring multiple forms of identification with a returned ballot, which significantly increased rejection rates, and allowing ballots with administrative deficiencies to be “cured,” which significantly decreased rejection rates. 

Ensuring All Votes Count: Reducing Rejected Ballots

“This brief studies trends in mail ballot rejection rates in 2020 compared to previous years and how different factors, including sets of policies and policy changes, the political environment, and voter outreach, may have contributed to these changes in an extraordinary election year. Our main findings include:

  • Mail ballot rejection rates decreased in most states in 2020 compared to 2018, and a number of states saw a consistent drop from 2016 to 2018 to 2020.
  • Certain states that adapted their voting laws to make mail voting more accessible in 2020, particularly in the South, saw especially pronounced changes in rejection rates.
  • In North Carolina, rejection rates vary from county to county. Previous studies of other states’ rejection rates found similar trends.
  • States that implemented mail ballot policies, including ballot curing, increased ease of access when returning mail ballots at boards of elections, early voting sites, drop boxes, and ballot tracking, saw lower rejection rates than those that didn’t, though we caution against assuming a causal relationship.
  • Previous academic and advocacy research suggests that voters of color, young voters, and first-time voters are disproportionately more likely to have their mail ballots rejected.”