Prior to the COVID-19 pandemic, some American states had transitioned to universal voting-by-mail, where all registered voters receive a mail ballot. But due to the pandemic, universal voting-by-mail was suddenly used in a larger number of states in2020. Here we study a unique situation in which registered voters in some legislative districts in Los Angeles County were subjected to universal voting-by-mail in theMarch 2020 primary. Using difference-in-differences and geographic boundary-based designs on individual-level records, we take advantage of this within-jurisdiction situation to estimate the causal effects of universal voting-by-mail on voter turnout and on who votes. Our results indicate that voter turnout increased by 3 to 4 percentage points for voters who do not automatically receive a mail ballot, and the increase is generally larger for registered partisan voters than those without a party affiliation.
The Impact of Universal Vote by Mail and Permanent Absentee Voting on Turnout in 2020 and 2022
This memo presents evidence on the efficacy of universal vote by mail (UVBM) and permanent absentee voting (PAV). With UVBM, all registered voters are sent a ballot in the mail without needing to proactively request one. With PAV (also known as “single signup”), voters sign up once to receive ballots in the mail for all subsequent elections.
Like other state voting laws (ID, early voting, etc.), UVBM and PAV may have a significant impact on whether people actually turnout to vote. Both methods significantly reduce the obstacles in the way of voting by bringing the polling place to the voter rather than making the voter go to the polling place. VoteAmerica has conducted a number of analyses aimed at assessing this impact and find that both methods substantially boost voter turnout.
Disability and Voter Turnout in the 2022 Elections
- Based on Census data, voter turnout increased in 2022 by 1.6 points among citizens with disabilities relative to the 2018 midterm elections, while it decreased among citizens without disabilities by 1.6 points.
- This increase helped close but did not eliminate the turnout gap between citizens with and without disabilities, which went from -4.8 points in 2018 to -1.5 points in 2022.
- The increased turnout among people with disabilities occurred across all disability types and demographic categories—gender, race/ethnicity, age group, and region—but was especially pronounced among young voters with disabilities.
Success of Mailed-out Ballot Access Policies Nationwide
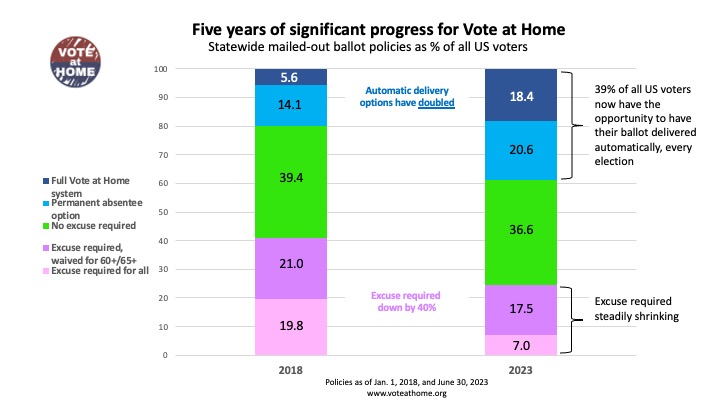
Much was written about the success of temporary policies states put in place for mailed-out ballot access during the 2020 election due to the pandemic. The resulting use of those ballots and the percentage of the popular vote they represented (about 47%) was indeed stunning. But a largely untold story is how rapidly voters across the country have had their access to mailed-out ballots improved on a permanent policy basis. The result was in the 2022 midterms about 32% of all ballots cast came from those voters received in the mail, up from about 21% in 2018.
Unite America: Analysis of the Impact and Progress of Four Political Reforms
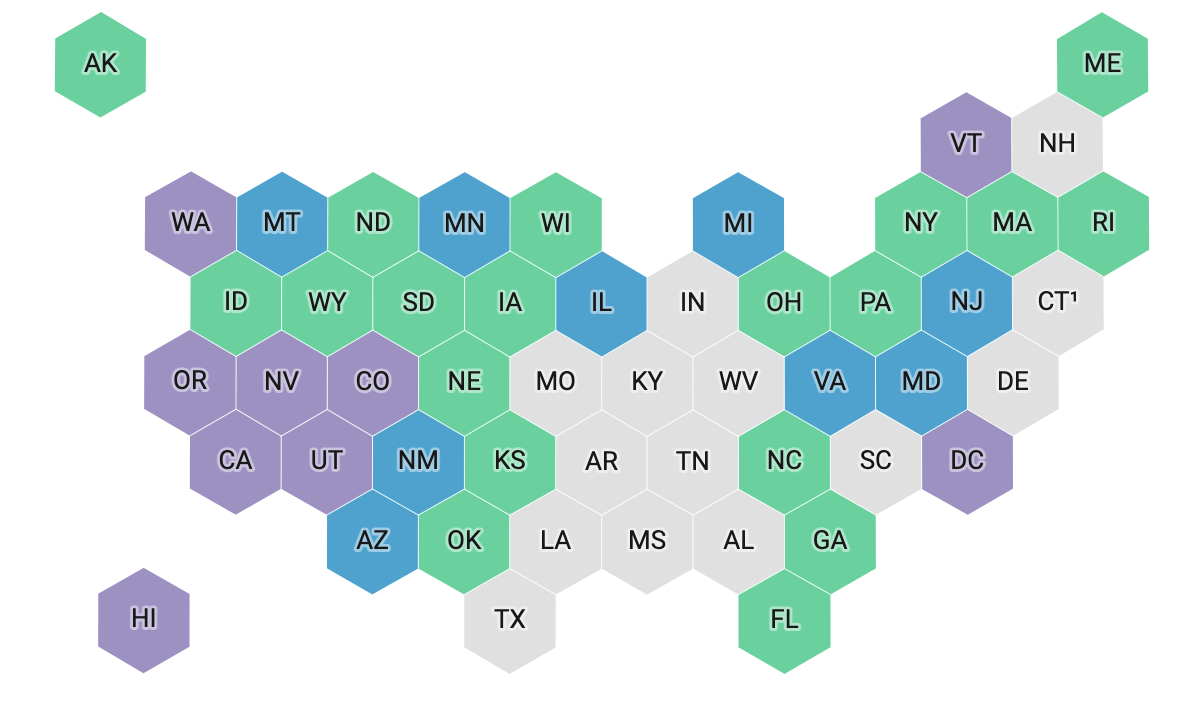
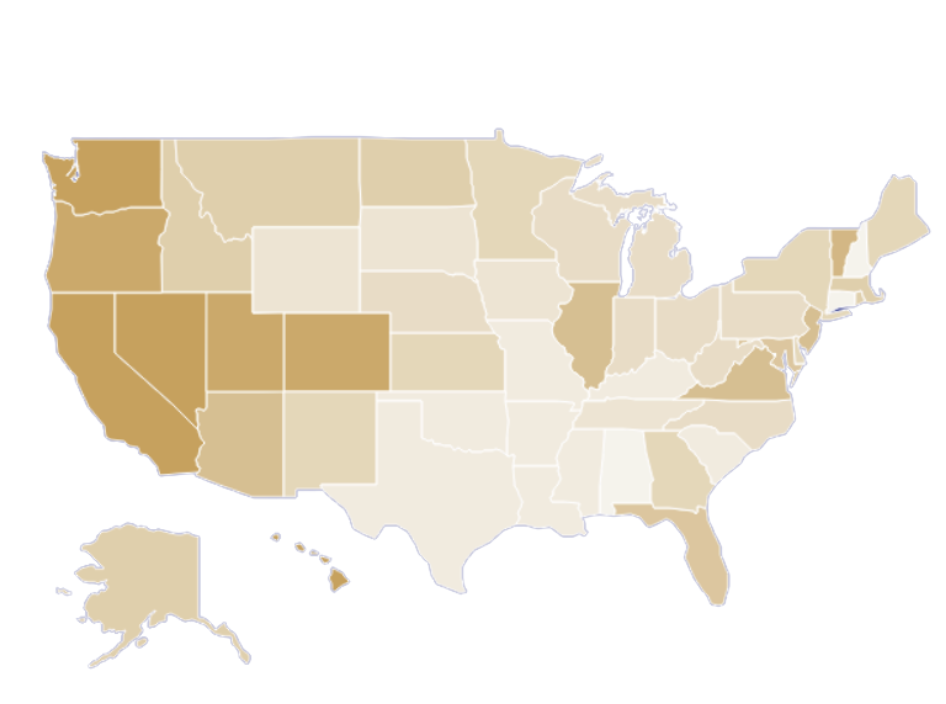
State Mailed-Out Ballot Policies (2024)
Vote at Home National Scorecard Ranking States by the Quality and Reach of their Mailed-out Ballot Policies
The interactive tool identifies and weighs 15 key state policies and practices to help citizens and state policy makers boost voter turnout and participation through the increased use of mailed-out ballots in U.S. elections
(March 15, 2023) — The National Vote at Home Institute (NVAHI) today issued their first-ever national scorecard highlighting how “Vote at Home friendly” all 50 states and the District of Columbia are in providing citizens access to, use of, and confidence in mailed-out paper ballots.
Based on 15 criteria that highlight three main principles (access, trust, and security), the scorecard is designed to focus on policy and budget decisions made by state legislatures, and to avoid implicit judgements that can’t be quantified. It scores the most significant steps and potential obstacles in facilitating a mail ballot’s journey from election officials to voters and back again.
States score well for adopting inclusive policies that increase access to and use of mailed-out ballots. For example, “local option” laws that allow the Vote at Home model in specific circumstances; or “permanent absentee,” allowing voters to choose to automatically receive their mailed-out ballot for at least four years of future elections. Other indicators include the availability of ballot tracking technology to notify voters when their ballots are dispatched, received, and counted; and “notify and cure” policies that give voters time to correct mistakes or update their signatures. Scores are based on state policies and practices as of March 15, 2023.
“This is the most focused and comprehensive scorecard of its kind, with criteria that provide a clear guide to boosting mail ballot use,” says Barbara Smith Warner, NVAHI Executive Director.
“The National Vote at Home Institute’s mission is to increase voter participation and election security through policies and processes that make it easier for voters to receive, track, and return mail ballots,” says Phil Keisling, NVAHI chair and former Oregon Secretary of State. “Our vision is for all active registered voters in America to automatically receive their paper ballots through the United States Postal Service, several weeks before each election, and then have access to multiple in-person options to ensure voters cast their ballots securely, and have their voices heard.”
Today, eight states — California, Colorado, Hawaii, Nevada, Oregon, Utah, Vermont, and Washington — and Washington, D.C. employ such “Vote at Home” election systems, and all rank high on the scorecard. Still, none received a perfect score of 65. In contrast, all of the ten lowest-scoring states have “excuse required” laws that mandate voters to provide a narrowly defined specific reason to vote by mail. “The rankings reflect which states are closest to the best-designed Vote at Home election systems, and which still have a long way to travel.” Smith Warner says.
The vote at home approach has proven increasingly popular with American voters by streamlining the ballot delivery process, so voters aren’t required to travel to specific locations to receive and cast their ballots. In the 2022 midterm election, a record-setting 35% of Americans voted using this method, with Oregon, the first state to mail all voters their ballot 25 years ago, having the nation’s highest turnout of eligible citizens (62.4% compared to 46.6% nationwide).
Over the last 20 years, NVAHI estimates over 1 billion ballots have been mailed out nationwide for presidential and midterm elections, party primary races, special vacancies, and local elections. Incidences of intentional or consequential fraud with mailed-out ballots have been virtually non-existent, while voter turnout has increased.
A recent study reveals that of the top ten states for turnout of 18-34 year old eligible voters in 2020, six sent mail ballots to all voters. Additionally, a peer-reviewed academic study found that states who implemented this approach in 2020 saw an average of 5.6% gain in turnout among registered voters, with no substantial partisan impact.
“The evidence is clear and compelling that when all eligible registered voters are mailed their ballot, it strengthens our democracy by increasing participation across all demographics,” Smith Warner noted.
NVAHI intends for its scorecard to provide a roadmap for state legislators, election officials, and citizens interested in moving their states closer to adopting full vote at home election systems. The criteria were selected and weighted to help policymakers identify and implement best practices for voting by mail, regardless of size, population or geography of each state.
MEDIA CONTACT: BARBARA SMITH WARNER (MEDIA@VOTEATHOME.ORG)
About the National Vote At Home Institute (NVAHI)
Founded in 2018, the National Vote at Home Institute is a non-partisan, 501(c)(3) organization whose mission is to increase voters’ access to, use of, and trust in mailed-out ballots to help boost citizen engagement and voter turnout in all U.S. elections. In addition to helping state and local election officials implement best practices for vote at home systems, NVAHI provides research, education, and advocacy services to promote mailed-out ballot use, including (where applicable) the adoption of full vote at home election systems where voters also enjoy various in-person opportunities for ballot receipt and return.
###
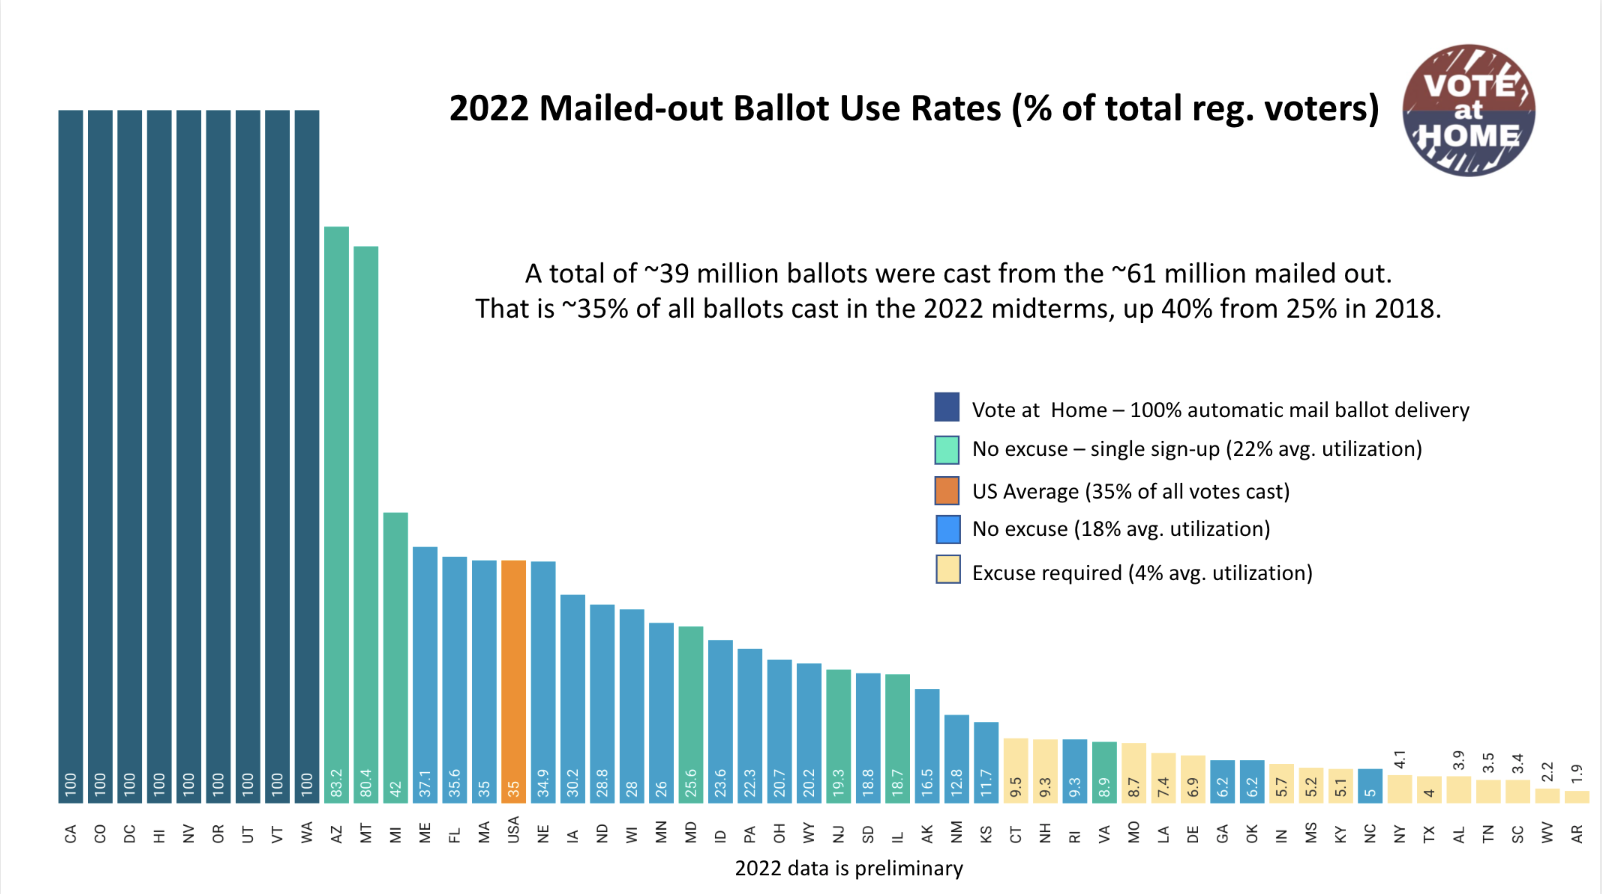
2022 Mailed-out Ballot Use Rates (% of total reg. voters)
A total of ~39 million ballots were cast from the ~61 million mailed out.That is ~35% of all ballots cast in the 2022 midterms, up 40% from 25% in 2018.
NVAHI Mailed-out Ballot Tracking and Forecasting Tool
October 14, 2022: Today the National Vote at Home Institute (NVAHI) launched a new tool to help journalists, legislators, elections officials and the public forecast the likely level and impact of mailed-out ballots for the 2022 general election.
Modeling Voter Participation in 2018 Midterm Election
In this research, we examine the difference between five vote-by-mail policies in place in the 2018 midterm elections. We use statistical modeling to understand the effects of different vote-by-mail policies nationwide and estimate what might have changed in 2018 based on different voting systems. In general, we find that turnout increases as states move along the vote-by-mail policy continuum, removing administrative obstacles for voters in the process. Additionally, turnout gains are largest when counties progress several steps from more restrictive policies to less restrictive policies, and the Vote at Home policy has the most potential to impact young voters.