A new midterm record – by a full 10% points.
November 18, 2022: As the final midterm numbers trickle in, NVAHI’s MOBET estimation tool hit the mark on a number of key metrics.
With about 211 million active registered voters nationwide, we estimate the total turnout in 2022 will come in with about 112 million votes cast – the same total as the US Election Project’s estimate, although ours has a slightly different makeup by state. That translates to a 53% turnout versus the 2018 midterm of 61% of active registered voters. Against that, about 61 million ballots were mailed-out to voters – slightly over the initial MOBET estimate of 60 million.
We now estimate 39 million mailed-out ballots million were cast, based on the scaled-down turnout seen across all voting methods. That means about 35% of all ballots cast were from those mailed to voters, up dramatically from 25% in 2018, and in line with MOBET’s original percentage forecast for 2022.
Here are how the return numbers stack up as of Thursday, November 17:
- Returned mailed-out ballots cast and counted: 35 million
- CA returned ballots yet to count: 1.9 million
- States not yet providing complete data (estimate): 1.1. million
- Provisional, to be cured, overseas yet to be counted (estimate): 1.0 million
- Forecasted total mailed-out ballots cast: 39 million
- Percentage of 112 million total votes cast: 35%
Six battleground states warrant further discussion. Two big ones changed from “excuse required” mailed-out ballot voting in 2018 to “no excuse” by 2022: Michigan and Pennsylvania. Nevada went all the way from no excuse to full “vote at home.”
In 2018, Michigan saw about one million mailed-out ballots cast. In 2022, that number jumped 80% to 1.8 million.
Even more impressive was Pennsylvania, where in 2018 about 200,000 mailed-out ballots were cast while in 2022 the numbers came in at about 1.2 million, a 6x increase!
Nevada had about 100,00 voters receive mailed-out ballots in 2018, while in 2022 all 1.8 million did, with about 1 million casting those ballots by return mail, into drop boxes, or in person.
Wisconsin did not change its policy but changed its behavior. In 2018, they had about 150,000 mailed-out ballots cast. In 2022, they are reporting 740,000, an almost 5x increase.
Arizona also did not change policy, but it saw mailed-out ballots rise from under 2.7 million in 2018 to almost 3.1 million, and overall turnout rise too, unlike many other states in 2022.
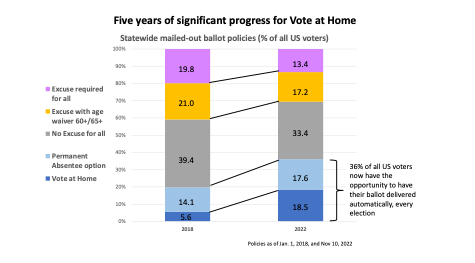
The MOBET tool presents mailed-out ballot totals – and eventual return rates – in four categories:
- 9 “Vote at Home” (VAH) jurisdictions, where every active registered voter receives a ballot in the mail automatically for every election
- 6 “No Excuse – Single Sign-Up” (NE/SSU) states, where any voter, through a single application, can sign up to automatically receive ballots for all future elections. Michigan now joins this group, bringing the total to seven going forward.
- 21 “No Excuse” (NE) states, where all voters are eligible to receive a ballot, but must request them for each specific election or every year
- 15 “Excuse Required” (ER) states, where most voters are ineligible to apply for a mailed-out ballot unless they meet a specific legally acceptable excuse
*VAH = CA, CO, DC, HI, NV, OR, UT, VT, WA
*No Ex-SSU = AZ, IL, MD, MT, NJ, VA
*No Ex = AK, FL, GA, ID, IA, KS, ME, MA, MI^, MN, NE, NM, NC, ND, OH, OK, PA, RI, SD, WI, WY
*Ex Req.= AL, AR, CT, DE, IN, KY, LA, MS, MO, NH, NY, SC, TN, TX, WV
^ MI moves to the SSU group going forward
Interestingly, if you aggregate the three “No excuse” groups (No excuse, No excuse with SSU, and VAH) turnout in 2022 was about 53.8% of active registered voters, a full 7% points higher than the Excuse required states at about 46.4%.
- Based on the numbers we now can see, in 2022 we also now expect:
- Excuse required states to see about 4% utilization (mailed-out ballots divided by active registered voters)
- No excuse states to see more than 4x that rate at about 17% utilization
- No excuse states that include SSU to see more than 5x the excuse required rate, at about 22% utilization
Vote at Home’s MOBET information tool relies on official data originating from state and local election officials, some of it compiled by trusted sources including the U.S. Elections Project and Catalist.