2022 Primary Turnout Driven by Abortion, Liz Cheney and Voting by Mail

The Fulcrum – Every state that relies heavily on voting by mail outperformed the national median during the 2022 primaries – but none of them led in turnout this year. That distinction went to Wyoming, where Rep. Liz Cheney ran in a statewide nominating contest, and Kansas, which put an abortion measure on the primary ballot.

But the seven states that do run vote-by-mail primaries were all in the top 20 – including four of the top seven – according to data collected by the National Vote at Home Institute.

The Rural Republicans who Ignored Trump and Voted by Mail

Washington Monthly – Emerson, Nebraska, is a farming town of 900 in the state’s sparse northeast expanse. Its Republican-leaning, nearly all-white population makes Emerson not unlike dozens of other rural communities in the state. It is unique, however, for being the only town in the state divided between three counties: Dixon County, which covers the western half of Emerson; and Dakota and Thurston Counties, which make up the northeastern and southeastern quadrants of the town, respectively.

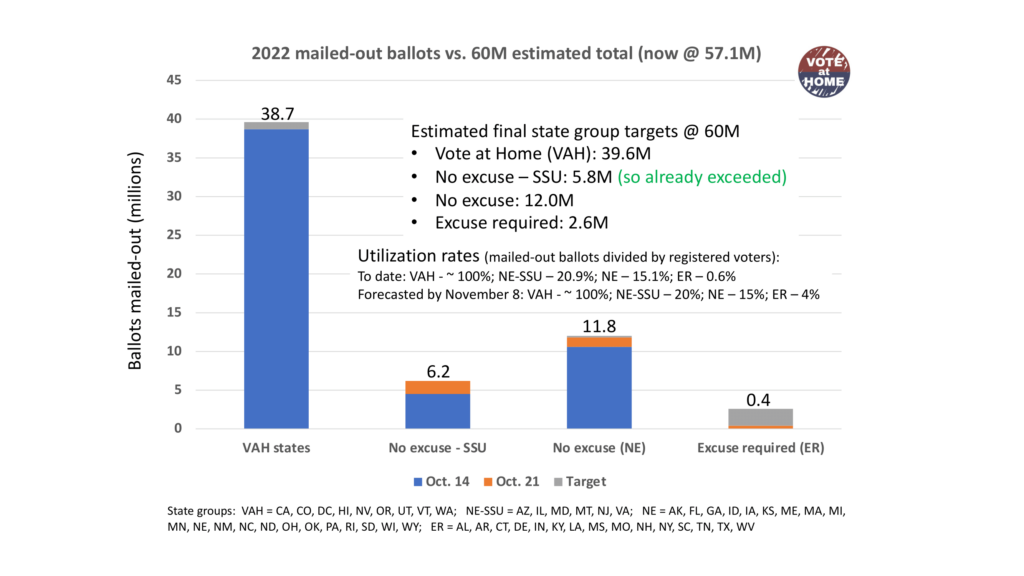
Mailed-Out Ballots Tracking for 60 Million Nationally in the November Midterms

NVAHI MOBET tool reports 57.1M already scheduled or requested, up from 53.8M last week.

Today the National Vote at Home Institute (NVAHI) updated the data from its Mailed-Out Ballot Estimation Tracker MOBET) from its initial launch on October 13. The tool was launched to help journalists, legislators, elections officials and the public forecast the likely level and impact of mailed-out ballots for the 2022 general election.

Our forecast remains: Mailed-out ballot activity will increase at least 40% in 2022 versus 2018 levels – to an estimated 60 million mailed-out, with over 42 million returned.

In contrast, in the 2018 midterms, the US Election Assistance Commission reported about 42 million mailed-out ballots issued, with about 30 million of them returned. Returned mailed-out ballots constituted roughly 25% of all votes cast that year. This year, it may hit 35%.

The MOBET tool presents mailed-out ballot totals – and eventual return rates – in four categories:

  • 9 “Vote at Home” (VAH) jurisdictions, where every active registered voter receives a ballot in the mail automatically for every election
  • 6 “No Excuse – Single Sign-Up” (NE/SSU) states, where any voter, through a single application, can sign up to automatically receive ballots for all future elections
  • 21 “No Excuse” (NE) states, where all voters are eligible to receive a ballot, but must request them for each specific election or every year
  • 15 “Excuse Required” (ER) states, where most voters are ineligible to apply for a mailed-out ballot, unless they meet a specific legally acceptable excuse

*VAH = CA, CO, DC, HI, NV, OR, UT, VT, WA
*No Ex-SSU = AZ, IL, MD, MT, NJ, VA
*No Ex = AK, FL, GA, ID, IA, KS, ME, MA, MI, MN, NE, NM, NC, ND, OH, OK, PA, RI, SD, WI, WY
*Ex Req.= AL, AR, CT, DE, IN, KY, LA, MS, MO, NH, NY, SC, TN, TX, WV

Many states where the voter must request a mailed-out ballot are not yet reporting their volume of requests. So, the 2022 numbers will continue to grow over the next few weeks as more voters apply for mailed-out ballots. For the 9 VAH states, mailed-out ballot growth will primarily result from increased voter registration totals.

As of October 21, 2022, you can see below that not only has the overall actual number climbed substantially to 57.1 million from 53.8 million a week ago, but one group – the “No Excuse – single sign-up” cohort has already exceeded the level forecasted by MOBET.

A few individual states deserve mention. The five new VAH states since 2018 (CA, DC, HI, NV, VT) will contribute about 11 million of the expected 17.4 million mailed-out ballot increase. But some states with more incremental policy changes are also major movers.

  • Massachusetts, which passed “no excuse for all” earlier in 2022 is up 10x, from 105,000 in 2018 to over 1 million today. The state also mails “absentee ballot request forms” to all registered voters.
  • Pennsylvania, which passed no excuse in 2018, is up almost 6x, from about 200,000 then to 1.2 million now.
  • Michigan, which also passed no excuse for all in 2018, is up 50% from 1.1 million to 1.7 million. Michigan has a citizen initiative, Measure 2, that contains SSU on the ballot in November.
  • Maryland, which passed a SSU law, is up almost 4x from about 140,000 to 570,000.

On average, mailed-out ballot utilization levels are expected to end up at:

  • Only about 4% of voters in the Excuse Required states
  • That jumps almost 4x to 15% of voters in the No Excuse states
  • And it jumps almost 5x to 20% of voters in the No Excuse – Single Sign-up states

Better mailed-out ballot access policies are welcomed and embraced by voters.

Vote at Home’s MOBET information tool relies on official data originating from state and local election officials, some of it compiled by trusted sources including the U.S. Elections Project and Catalist. See the original press announcement here: https://voteathome.org/national-vote-at-home-institute-launches-new-mailed-out-ballot-tracking-forecasting-tool/

###

National Vote at Home Institute Launches New Mailed-Out Ballot Tracking and Forecasting Tool

Mailed-Out Ballot Estimation Tracker (MOBET) will provide key insights into 2022 election.

Today the National Vote at Home Institute (NVAHI) launched a new tool to help journalists, legislators, elections officials and the public forecast the likely level and impact of mailed-out ballots for the 2022 general election.

In the 2018 midterms, the US Election Assistance Commission reported about 42 million mailed-out ballots issued, with about 30 million of them returned. Returned mailed-out ballots constituted roughly 25% of all votes cast that year.

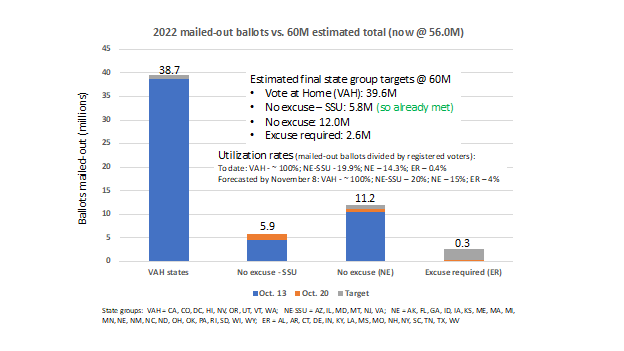
Our initial forecast (as of 10/14): Mailed-out ballot activity will increase at least 40% in 2022 versus 2018 levels – to an estimated 60 million mailed-out, with over 42 million returned.

Vote at Home’s MOBET information tool relies on official data originating from state and local election officials, some of it compiled by trusted sources including the U.S. Elections Project. (See Methodology below)

The MOBET tool presents mailed-out ballot totals – and eventual return rates – in four categories:

  • 9 “Vote at Home” (VAH) jurisdictions, where every active registered voter receives a ballot in the mail automatically for every election
  • 6 “No Excuse – Single Sign-Up” (NE/SSU) states, where any voter, through a single application, can sign up to automatically receive ballots for all future elections
  • 21 “No Excuse” (NE) states, where all voters are eligible to receive a ballot, but must request them for each specific election or every year
  • 15 “Excuse Required” (ER) states, where most voters are ineligible to apply for a mailed-out ballot, unless they meet a specific legally acceptable excuse

Many states where the voter must request a mailed-out ballot are not yet reporting their volume of requests. So, most states’ 2022 numbers will grow over the next few weeks as more voters apply for mailed-out ballots. For the 9 VAH states, mailed-out ballot growth will primarily result from increased voter registration totals.

As of October 14, 2022, NVAHI estimates that about 18 million more ballots will be mailed out in 2022, compared to 2018 — 60 million vs. 42 million — and that if historic return rates apply, at least 12 million more ballots will be returned (42 million vs 30 million).

In addition to providing 2018 benchmark information and showing current 2022 totals of mailed-out ballots, the table below includes estimates for eventual 2022 mailed-out ballots sent and return rates based on NVAHI research. (M = millions

State Group (*see key below(
Registered Voters as of 10/14
Percent of total US registered voters
2022 mailed-out ballots to be sent as of 10/14
2022 Estimated mailed-out ballots sent – on 11/8
2022 Estimated mailed-out ballots cast (turnout %)
2018 mailed ballots sent out
2018 mailed out ballots cast
Vote at Home (VAH)
38.7M
18.1%
38.7M
39.6M
25.7M (65%)
26.4M
17.1M
No Excuse – SSU
29.6M
13.9%
4.5M
5.8M
4.3M (74%)
4.4M
3.3M
No Excuse for all
79.5M
37.3%
10.6M
12M
10.2M (85%)
9.1M
7.8M
Excuse Required
65.5M
30.7%
<0.1M
2.6M
2.3M
2.5M
2.3M
Totals
213.2M (~215M expected by 11/8)
100%
53.8M
60M
42.6M (71%)
42.2M
30.4M

*VAH = CA, CO, DC, HI, NV, OR, UT, VT, WA

*No Ex-SSU = AZ, IL, MD, MT, NJ, VA

*No Ex = AK, FL, GA, ID, IA, KS, ME, MA, MI, MN, NE, NM, NC, ND, OH, OK, PA, RI, SD, WI, WY

*Ex Req.= AL, AR, CT, DE, IN, KY, LA, MS, MO, NH, NY, SC, TN, TX, WV

If the 2022 turnout rate matches 2018, that will equate to about 118 million votes cast, so mailed-out ballots will account for 35%.

That 35% is a remarkable jump from 25% just four years ago, this time with no COVID driver.

Finally, it is interesting to see how policy drives behavior. 

On average, mailed-out ballot utilization levels are:

  • Only about 4% of voters in Excuse Required states
  • That jumps almost 4x to 15% of voters in No Excuse states
  • And it jumps almost 5x to 20% of voters in No Excuse – Single Sign-up states

Better mailed-out ballot access policies are welcomed and embraced by voters.

Methodology:

While the best official source for mail ballot use in the 2022 election – the U.S. Election Assistance Commission’s EAVS report – won’t be published until mid-2023, NVAHI has high confidence in the data presented here. In addition to our long-standing expertise and our daily monitoring of data from official sources, we are appreciative of data and analysis being compiled and made timely available to us and others by various other entities, most notably the U.S. Elections Project and Catalist (a major list vendor). Since some of this data is proprietary, our weekly summaries will aggregate individual state data into the four “policy buckets” mentioned above. However, we will publish and analyze some state-specific data if it’s entirely available from official public sources. One final note about terminology, and why we use “mailed-out ballots.” The MOBET tool focuses on how voters receive their ballots, not how they are ultimately cast. The term “vote by mail” can wrongly imply that mailed-out ballots must also be returned through the U.S. Postal Service. Although most mail ballots are returned this way, in many full “Vote at Home” election system states – e.g., Oregon and Colorado — more than 50% of mailed out ballots are actually cast in-person, as voters return them to secure drop boxes, official voting centers, or elections offices.
###

Red wave or Blue wave? No, Paper Wave!

Every two years, political pundits sift through party primary election results, speculating as to whether a red wave or a blue wave is coming ashore in November. With the 2022 primary season now over, a far more important wave is staring us right in the face.

The Paper Wave.

This Paper Wave involves mailed-out ballots – and specifically, the dramatic differences in voter turnout that occurred under the three very different policy frameworks U.S. states currently use.

First, in primarily “Vote at Home” (VAH) states, ballots are automatically mailed to most or all active registered voters.

Second, there are the nation’s “No Excuse” states, where mailed-out ballots are available to any voter who requests one.

Third, roughly a dozen “Excuse Required” states still cling to an outdated notion that voters should be treated as truant schoolchildren, needing a note from a parent or doctor to have their ballot mailed to them.

The 2022 “Paper Wave” is dramatically captured by the wide variance in 2022 primary election voter turnout rates, as calculated by NVAHI based on state-reported vote totals and registered voter counts.

  • Vote at Home states’ turnout average:  35%
  • No Excuse states’ turnout average: 26%
  • Excuse Required states’ turnout average: 19%

Primary contests can certainly vary state-to-state in terms of their national importance and local intensity. For example, 2022’s two highest turnout states were Wyoming with its “Liz Cheney referendum” election (63%); and Kansas with its abortion rights ballot measure (48%).

But absent these two contests, the “Top 10” list for primary election turnout included seven of the nation’s eight VAH states. Even relatively dull primaries in VAH states – e.g, Hawaii and Washington state, both at 40% — far exceeded turnout in states like Ohio (21%), Texas (19%) and New York (11%).

Meanwhile, seven of the bottom 10 states were “Excuse Required,” in which fewer than one in five registered voters participated.  

The power of the Paper Wave is simply this: voters with a ballot in their hands vote at materially higher levels than those who must schlep to a physical polling place. And this phenomenon repeats even within No Excuse states that still require voters to apply for their mailed-out ballots. 

For example:

In Florida, 42% of voters who received a mailed-out ballot returned them, compared to a 19% turnout rate among the remaining polling place voters. Among Maryland voters, the differential was three times that: 64% vs. 19%. 

Michigan was more impressive still: an 84% return rate among mail-ballot voters versus 13%, a sixfold difference. Half of all votes cast in Michigan’s 2022 primary came from mailed-out ballots – compared to just 27% in the 2018 midterms. 

Then there’s Nebraska, with its “one-of-a-kind” law that gives certain counties the legal authority to automatically mail ballots to all active registered voters. The 11 counties that chose this approach in 2022 had a 55% turnout — compared to the rest of the state at 34%.  

One more side-by-side comparison is instructive. For 2022, both Massachusetts and Rhode Island moved to a “no excuse” policy for mail ballots. But Massachusetts’ new law also directed the secretary of state to mail a ballot application form to all registered voters.  

Nearly 1 in 6 Massachusetts voters — just over 700,000 – signed up. And about 69% of them returned their primary ballots, versus a 14% turnout rate among remaining polling place voters.

Rhode Island legislators didn’t require mailing out applications – and under 3% of its voters requested mail ballots for its primary. Even so, 77% of those voters cast ballots, versus 17% of the remaining polling place voters.

To be sure, voters in No Excuse states who request a mailed-out ballot in advance are arguably “more motivated” to vote. But that hardly accounts in full for three times – much less six times – differences in turnout. Not to mention the notably high turnout in states where all voters automatically received such ballots, with no application required. 

Now that the “Paper Wave” primary season of 2022 is behind us, an obvious question presents itself. How much more “hidden in plain sight” evidence is needed to recognize that when mail ballots are made far accessible – if not a “given” prior to every election – that the real winners are American voters and our democracy?